 Nestronics
Nestronics
Nestronics
This web page shows how you can quickly setup your own Urinary Flow meter using a Raspberry Pi.
In my implemenation I chose to use a 5 gallon pail placed conveniently beside the bed, for easy access.
You barely need to wakeup to use it, as it is all automatic. Also with the tube extending down to close
to the bottom of the collection container, it is completely silent.
A urinary flow meter measures millilitres of urine per second. The easiest way to measure flow rate
is to measure the weight change versus time and convert to flow rate. Fortunately the conversion
is very simple. Since 1 millilitre of water weights 1g, if we measure a weight change of 1g in one second then we know
the flow rate is 1ml/sec.
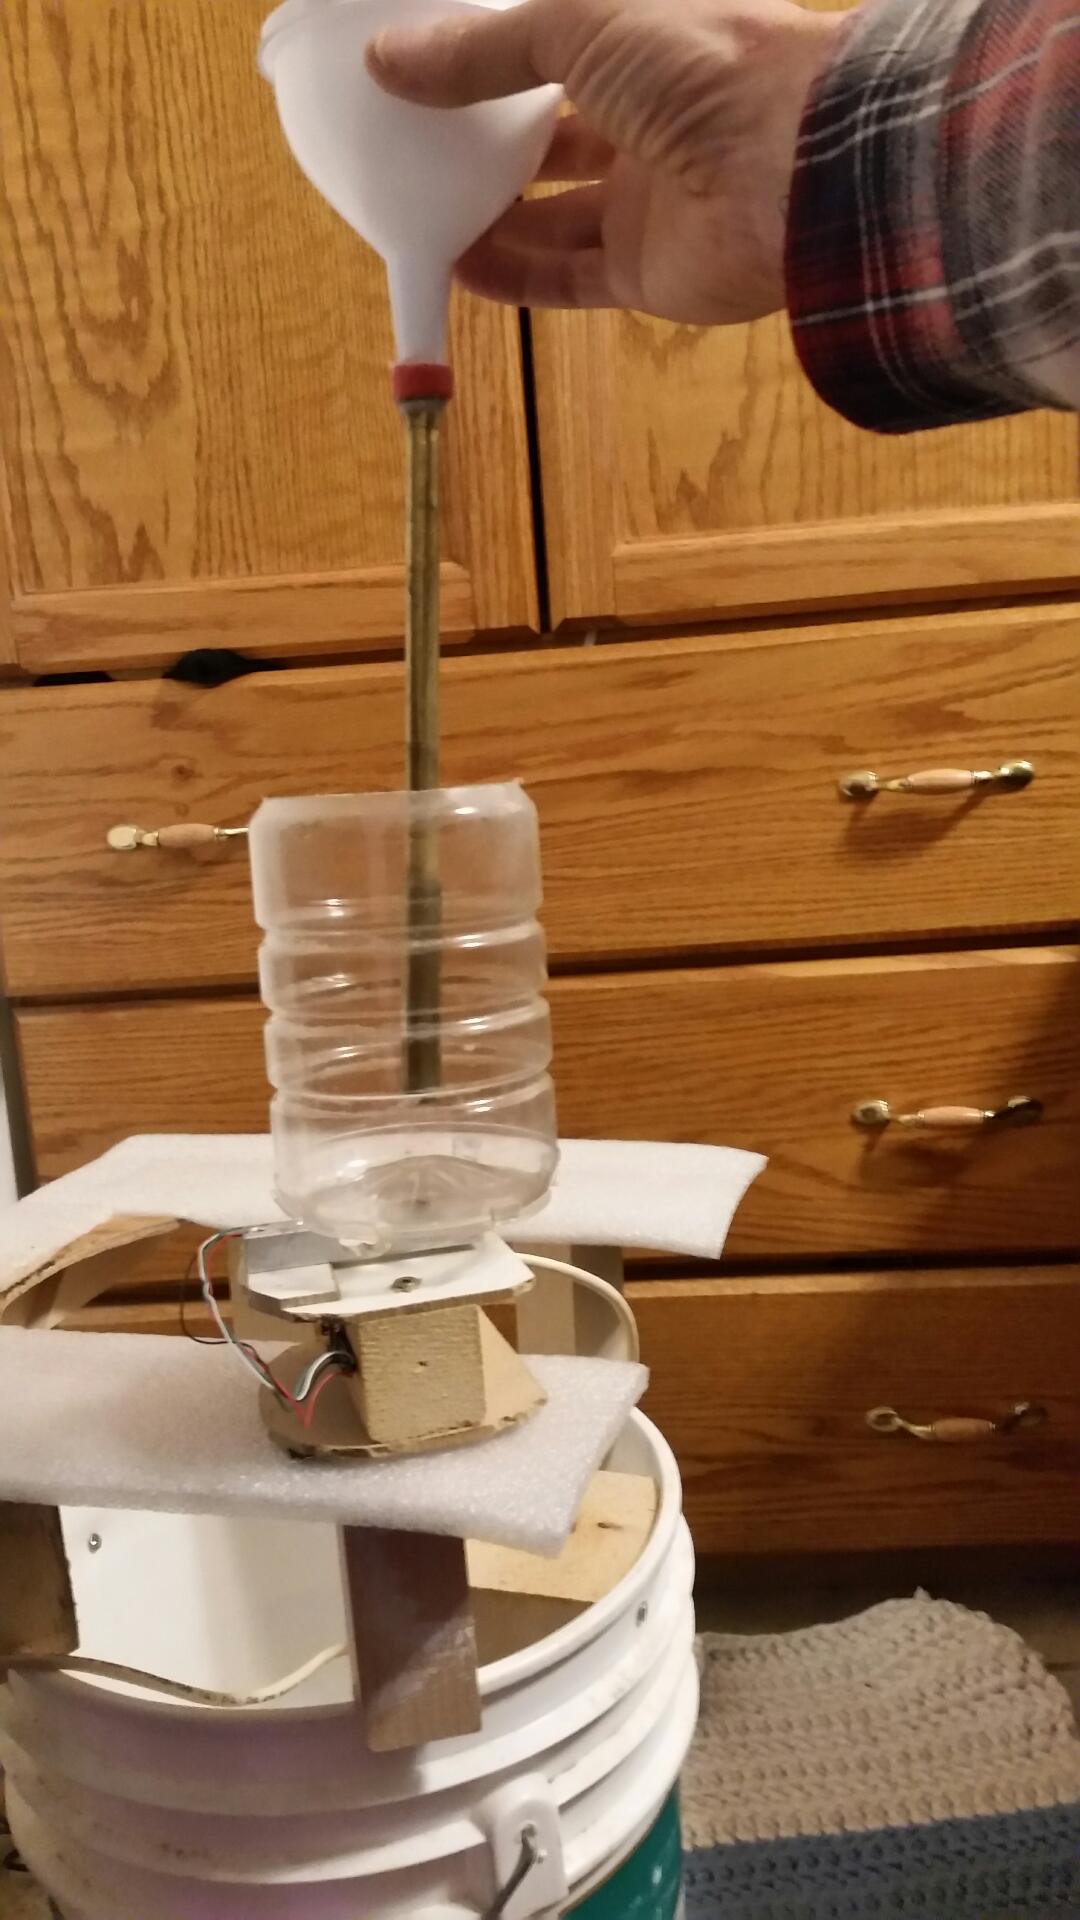
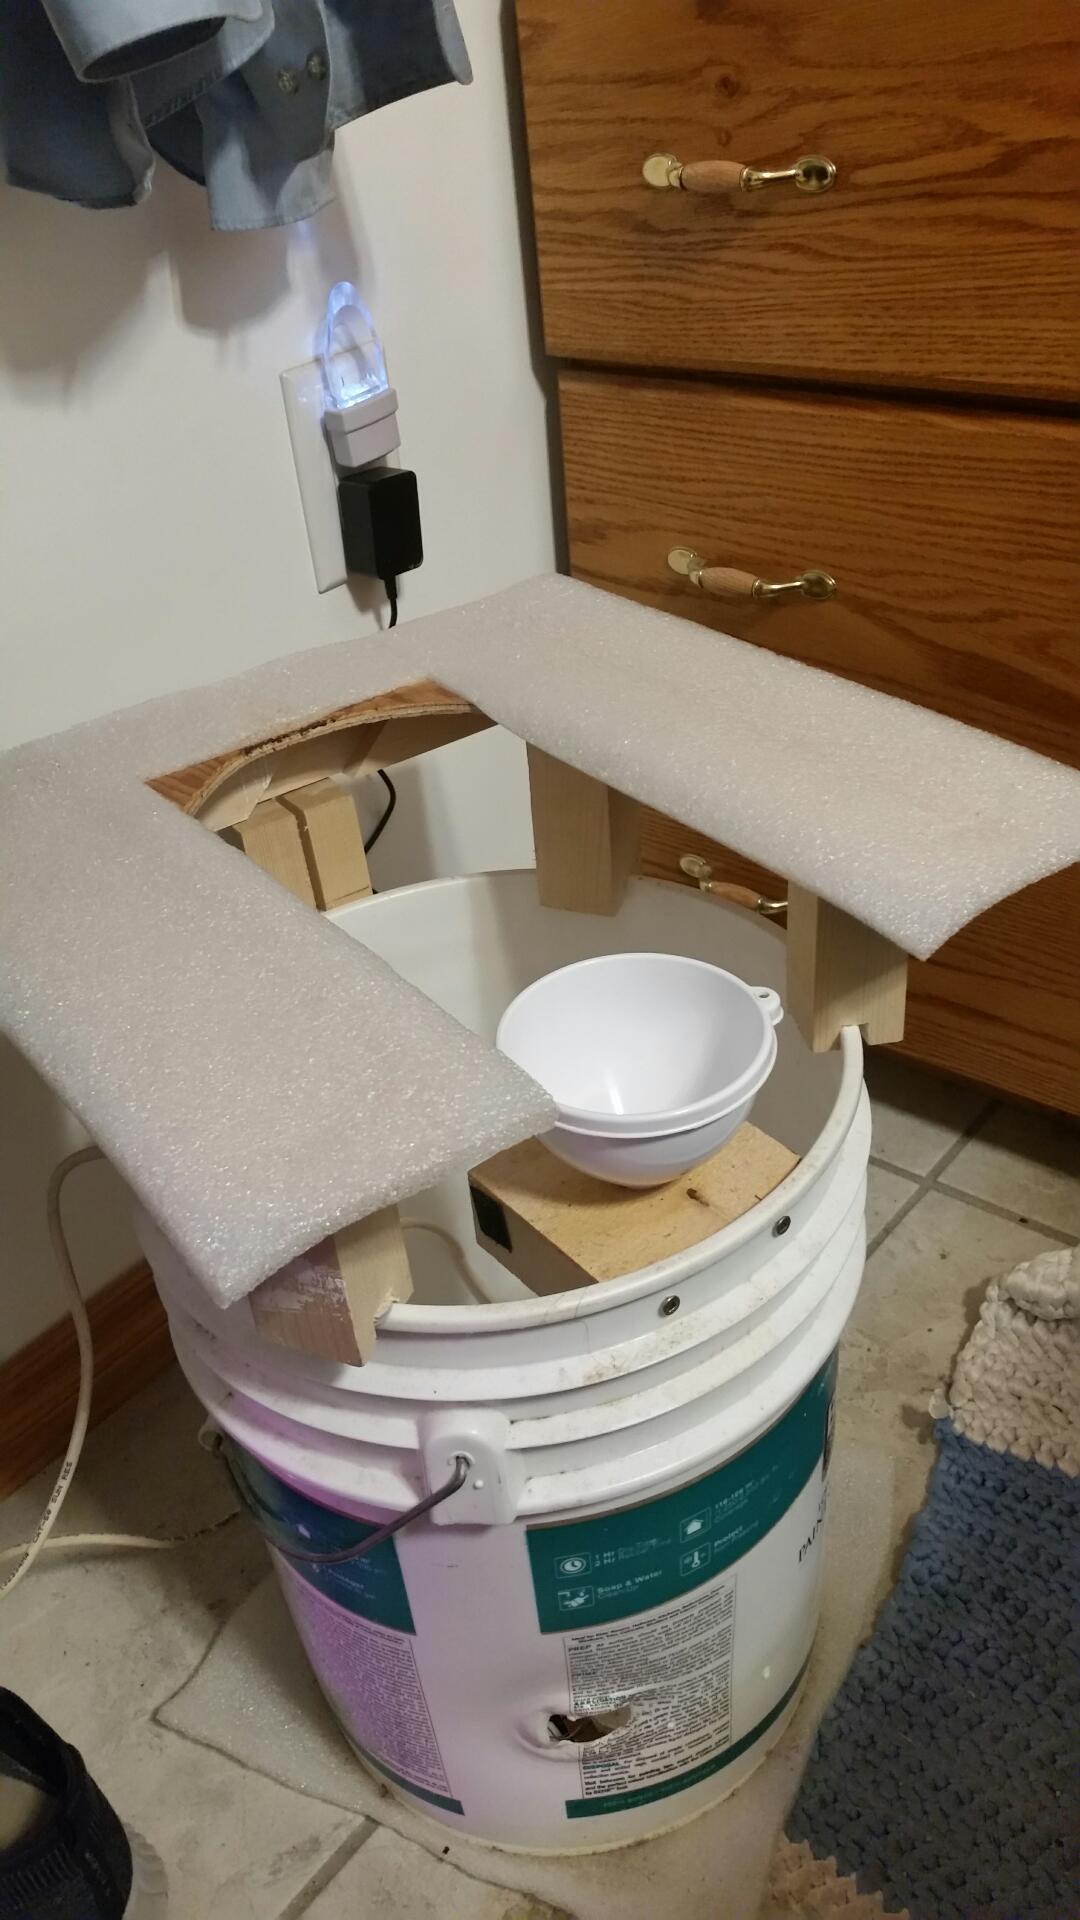
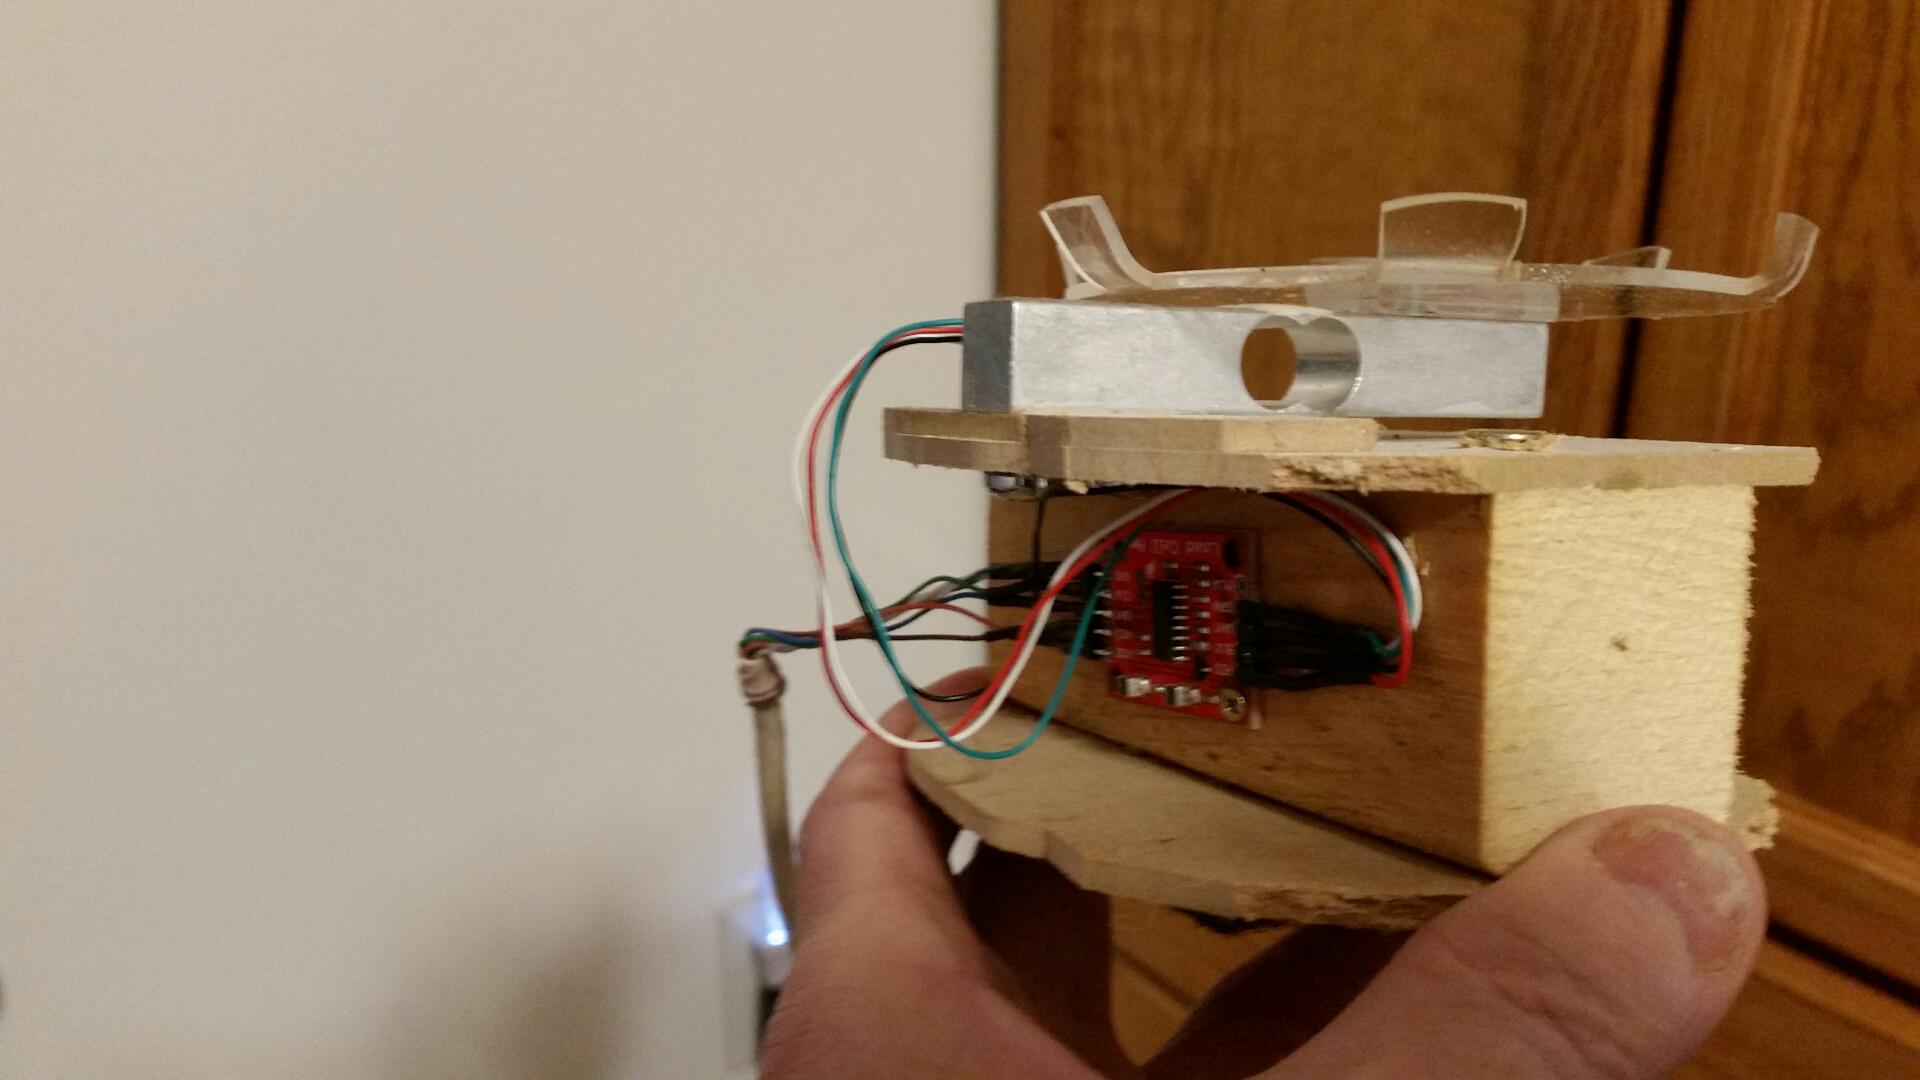
The above picture shows the basic structure:
-funnel to collect the urine.
-container to hold the urine.
-loadcell assembly to measure the change in weight versus time.
Further Flow definitions are in this pdf file.
Many studies use urinary flow rates.
A sample of those studies are in this
pdf file.
The basic components of the flow meter are:
1. Load Cell (recommend 1kg size : Adafruit 4540)
Load Cell from Digikey
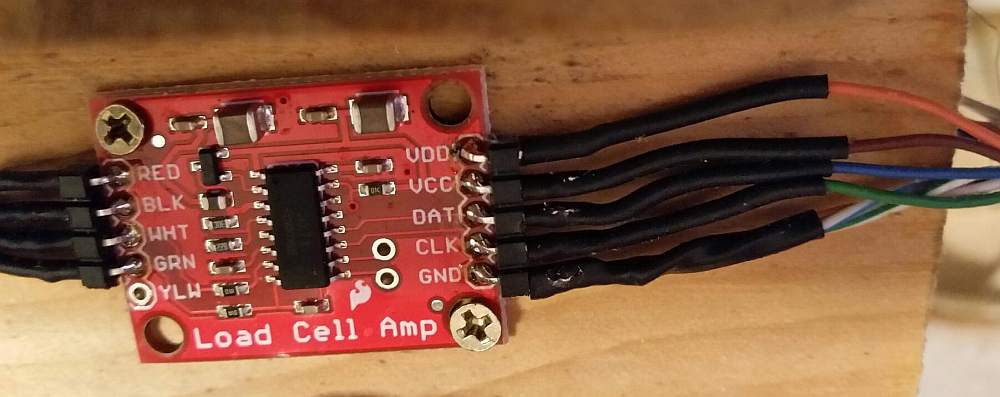
2. Load Cell Amplifier: HX711 type Sparkfun SEN-13879
Load Cell Amp from Digikey
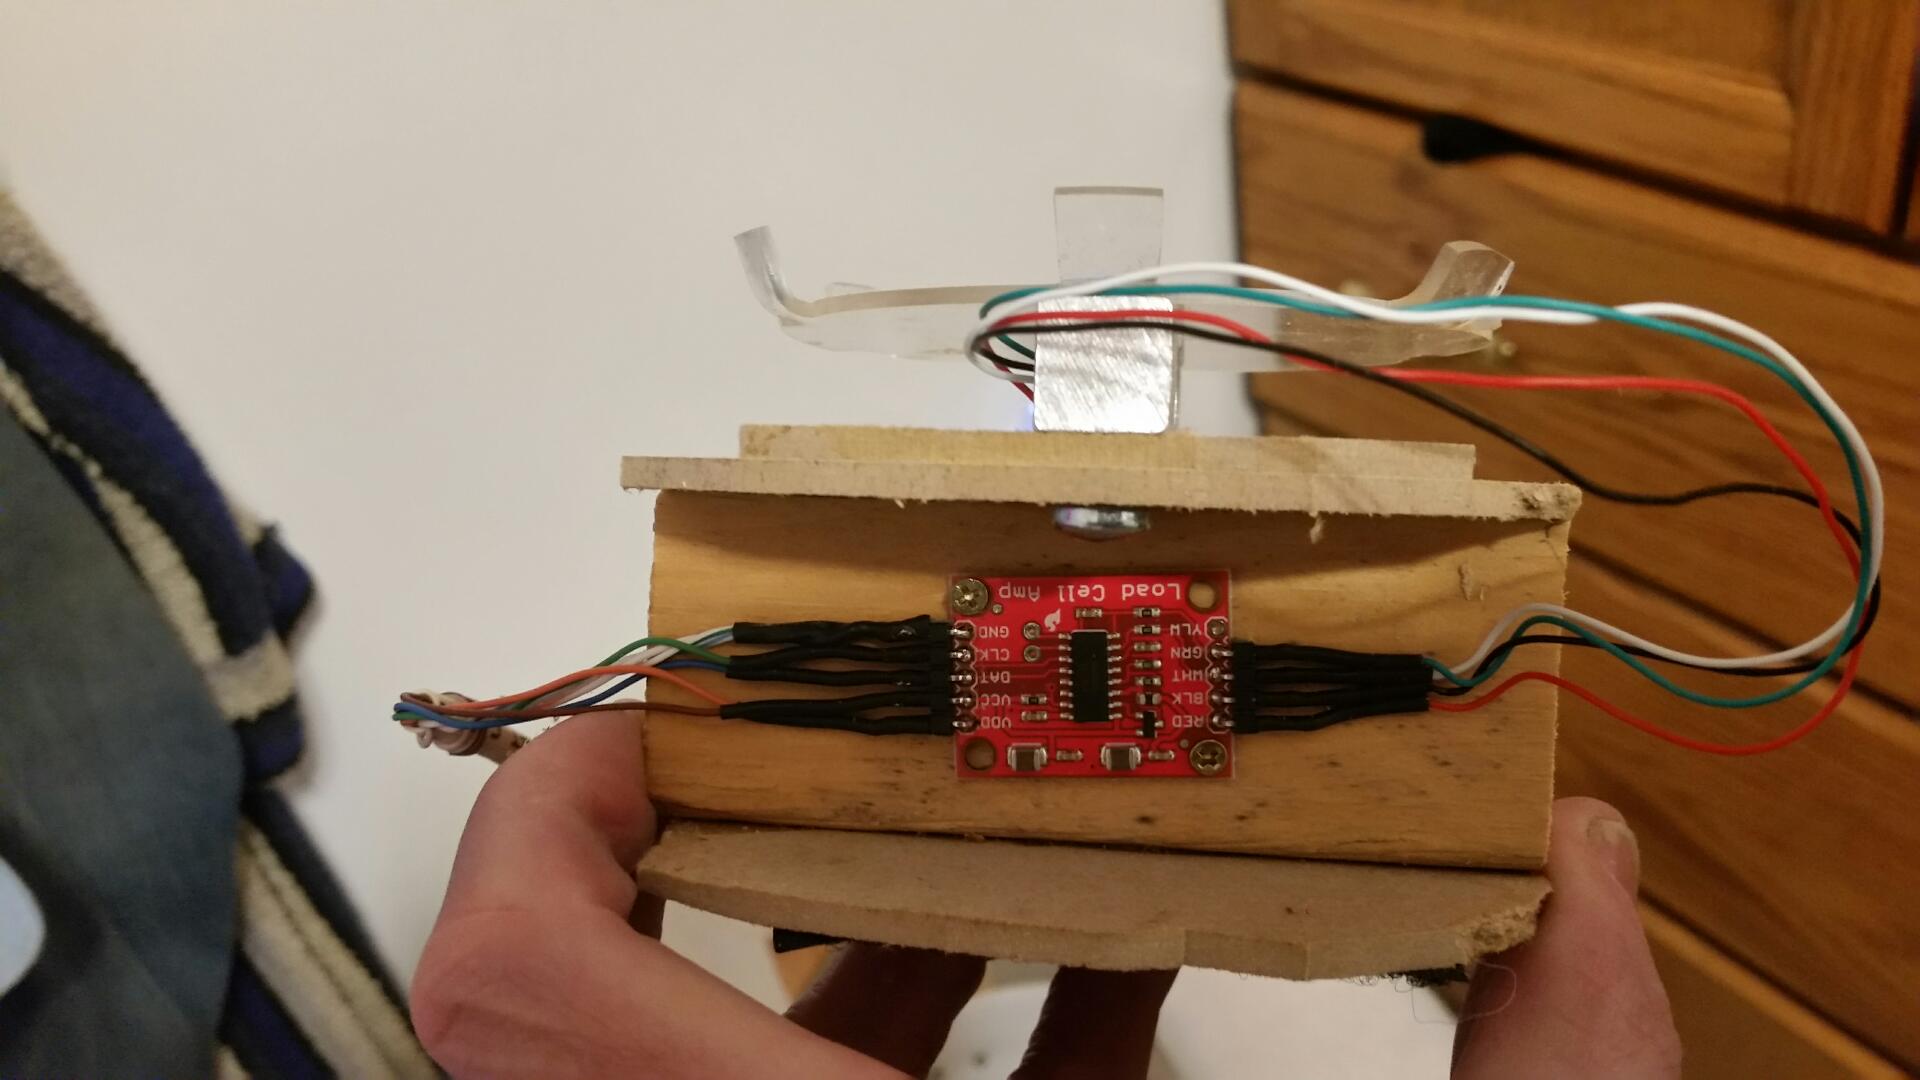
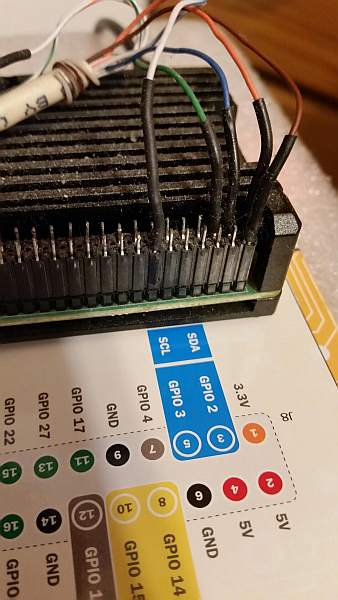
wiring from the load cell Amplifier to the Raspberry Pi:
// wires from Load Cell Amp to the Raspberry PI (use ethernet wire)
// 3.3V(Vdd) - Orange (goes to 3.3V, pin 1 on Raspberry Pi
// 5v(Vcc)   - Brown (goes to 5V, pin 2 on Raspberry Pi)
// Data      - Blue  (goes to SDA, pin 3 on Raspberry Pi)
// Clk       - Green (goes to SCL, pin 5 on Raspberry Pi)
// Gnd       - white or stripped (3 in total) (GND, Pin 14 on Raspberry Pi)
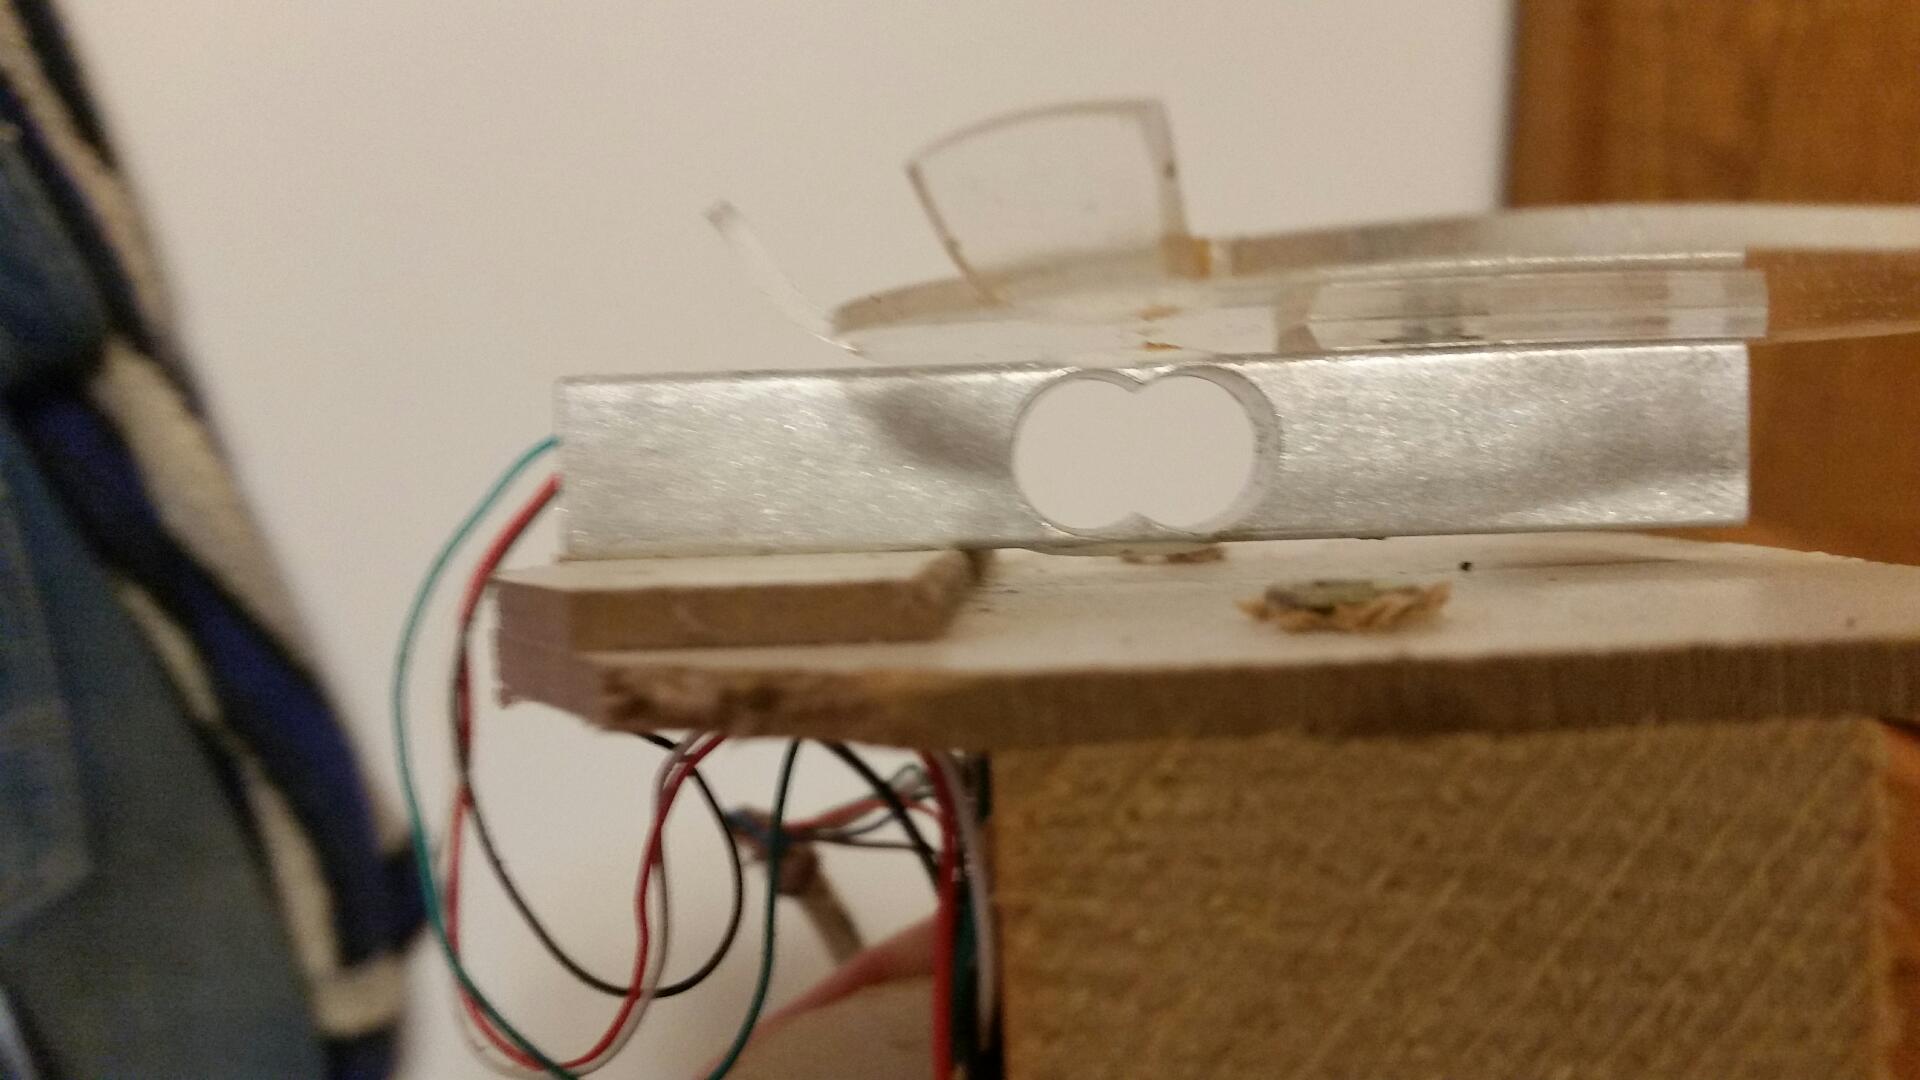
The wiring details are shown in these photos:
3. Raspberry Pi (likely any version)
Raspberry Pi from Digikey
The Raspberry Pi HX711 C++ Library software is available from:
https://github.com/endail/hx711
Install the software as follows:
pi@raspberrypi:~ $ git clone --depth=1 https://github.com/endail/hx711
pi@raspberrypi:~ $ cd hx711
pi@raspberrypi:~/hx711 $ make && sudo make install
pi@raspberrypi:~ $ sudo ldconfig
Download the hxBPH.cpp file and place it in the Raspberry Pi /home/pi directory
Also install gnuplot and imagemagick (recommended) on the raspberry pi:
pi@raspberrypi:~ $ sudo apt-get install gnuplot-x11
pi@raspberrypi:~ $ sudo apt-get install imagemagick
Calibrate the load cell
Run the calibration program as follows:
pi@raspberrypi:~ $ sudo /home/pi/hx711/bin/hx711calibration 2 3
then enter the returned calibrations number on line 82 of the hxBPH.cpp program.
Example: AdvancedHX711 hx(2, 3, 1104, 152084, Rate::HZ_10);
Compile using:
pi@raspberrypi:~ $ g++ -std=c++20 -Wall -o hxBPH hxBPH.cpp -lhx711 -llgpio
Run using:
pi@raspberrypi:~ $ sudo /home/pi/hxBPH
It is also useful to have the program start up power up using the crontab.
Using a command prompt, type crontab -e then paste in the following:
@reboot sudo /home/pi/hxBPH
# also try to start every 5 mins (will exit if already running)
*/5 * * * * sudo /home/pi/hxBPH
I also set up the Raspberry Pi to VNC into it remotely, so it never needs a keyboard, mouse or monitor.
The cpp program on the raspberry pi continually reads the weight 10 times per second. It automatically
detects a urine session, saves the data and graphs each result.
An example data file is 2024-04-02-Time-12-49-qM-68-qT-137.dat
Note that the name of the file can be broken down to the following information:
1. Date and Time
2. qMax (qM-68, is 6.8ml/sec)
3. Total Flow volume (qT-137, is 137ml total volume)
An example resulting graph for 9.2ml/s and total volume of 186ml is shown here:
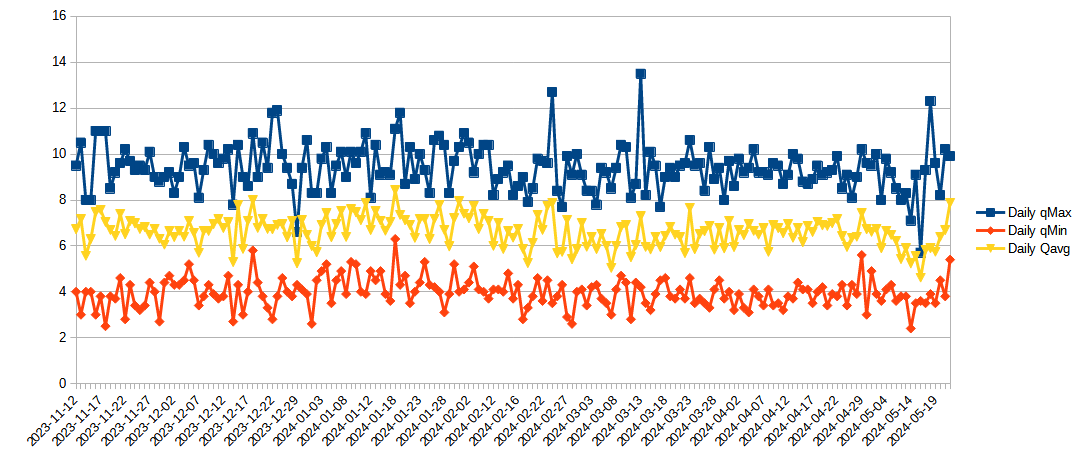
It is also useful to compile long time stats of changes in flow rate, etc. This is done by coping and pasting all the file names into a spread sheet. File names can be exported using the follow command line:
pi@raspberrypi:~ $ ls *.dat > list-2024-05-22.txt
An example spreadsheet in libre office is FlowAnalysis-2024-04-03.ods
An example graph of flow rate versus time is shown below:
Another view of the Scale Assembly.